Key Takeaways 📈 📊
- Social Media Data Analysis Transcends Basic Metrics: Beyond likes and shares, social media data analysis uncovers deep layers of user interactions, preferences, and behaviors, offering critical insights into trends and audience dynamics.
- Exponential Growth of Social Media Data: The transformation of platforms like Facebook and Twitter into vast data repositories reflects increased data volume, variety, and velocity, essential for understanding real-time public opinions and cultural dynamics.
- Personal Information: A Double-Edged Sword: While personal data from social media interactions is invaluable for crafting targeted marketing campaigns, it raises significant privacy and ethical concerns.
- Leveraging Structured Data for Targeted Marketing: Social media’s structured data, such as user demographics, enables precise audience targeting, crucial for effective advertising and understanding audience needs.
- Unstructured Data: A Rich Source of Insights: Analyzing unstructured data like text posts and images, requiring sophisticated techniques like NLP, is key for sentiment analysis and gauging public opinion.
- Semi-Structured Data: Bridging Analytical Gaps: Semi-structured data, exemplified by social media hashtags, balances structured and unstructured data, offering insights into user engagement and popular trends.
- User-Generated Content as a Data Goldmine: UGC on social media is not only a form of user expression but also a valuable data source for real-time insights into public opinion and emerging trends.
Social media data analysis has emerged as an invaluable tool for understanding the vast digital footprints left by users across platforms and devices. By examining the nuances of social interactions, preferences, and behaviors, this analytical approach provides unmatched insights into contemporary trends, audience tastes, and the fluid dynamics of online communities.
- Spending on marketing analytics is forecasted to increase by over 200% in the next 3 years, as CMOs emphasize data-driven marketing strategies (Source)
- Key benefits of investing in marketing analytics include better campaign optimization, identifying high-performing channels, measuring impact on business performance, and gaining competitive advantage (Source)
More than just tallying likes and shares, social media data analysis operates at the intersection of technological innovation and human communication. The data itself encompasses an intricate amalgam of statistics, numbers, and the diverse expressions of millions of users worldwide. For businesses, marketers, and social scientists, these data points uncover patterns and proclivities that would otherwise remain obscured.
In exploring this field, it is critical to recognize the multifaceted complexity inherent in social media data. Each data point forms part of a larger tapestry woven from users’ engagements, connections, and interactions across digital platforms. By analyzing these points in aggregate, compelling revelations emerge regarding consumer behaviors, societal tendencies, and the very fabrics of modern digital life.
As we will see, social media data analysis is equally capable of illuminating the granular details of specific campaigns as it is of spotlighting macro-level shifts in society itself. The insights it provides are as diverse as the data inputs and human experiences that shape it.
The Growth and Importance of Social Media Data
Leverage the diverse and voluminous data from social media platforms to understand customer sentiments and tailor marketing strategies.
The significance of social media data has grown exponentially with the proliferation of digital platforms. Platforms like Facebook, Twitter, Instagram, and LinkedIn have transformed from mere networking sites to colossal databases with user information. The immense growth of social media data is not just in its volume but in its variety and velocity. Every tweet, post, comment, and reaction contributes to a continuously expanding data universe.
This growth raises an important question: why is this data so crucial? The answer lies in its ability to mirror the complex tapestry of human society. Social media data reflects real-time public opinions, emerging trends, and shifting cultural dynamics. This data is a treasure trove for market research, enabling businesses to understand customer sentiments, track brand reputation, and tailor their marketing strategies accordingly. Social media data analysis in politics can reveal public opinion trends and engagement levels, providing insights beyond traditional polling.
The Role of Personal Information in Social Media
The delicate and often contentious subject of personal information lies at the heart of social media data analysis. Every interaction on social media, whether a like, share, or comment, is a piece of personal information that contributes to the larger narrative of an individual’s digital persona. This personal information is what makes social media data so valuable and, at the same time, sensitive.
The role of personal information in social media goes beyond just being data points; it forms the basis of personalized experiences. Social media platforms use this data to curate content, suggest connections, and influence purchasing decisions. For marketers and businesses, personal information offers insights into consumer behavior, preferences, and lifestyles, enabling them to craft targeted and effective marketing campaigns.
However, this use of personal information is not without its challenges. It raises significant questions about privacy, consent, and data security. The ethical implications of using personal data for analysis and marketing are substantial. Users are increasingly aware of how their data is used, leading to a growing demand for transparency and control over their personal information.
Craft targeted marketing campaigns by analyzing personal information from social media interactions like likes, shares, or comments.
Thus, while personal information is a cornerstone of social media data analysis, it is also a field that requires careful navigation and respecting user privacy while extracting valuable insights.
Understanding Different Data Formats in Social Media Analysis
When diving into social media data analysis, one must understand the various data formats one might encounter. These formats, each with unique characteristics and complexities, form the backbone of data analysis. They dictate the approach analysts take to extract, process, and interpret data. Data comes in many forms in social media – from the neatly organized and easily quantifiable to the more abstract and nuanced.
Structured Data in Social Media
Structured data is like a well-organized file cabinet, where everything is neatly categorized and easily located. In social media, structured data refers to highly organized information easily searchable by simple, straightforward algorithms. This includes user demographics (age, gender, location), post times, likes, shares, and comments counts.
A prime example of structured data in action is how a social media platform like Facebook uses user demographics to target advertisements. An advertiser can specify an audience based on age, location, and interests, and Facebook’s algorithms use structured data to display the ad to relevant users. This data is invaluable for businesses looking to understand their audience and tailor their marketing efforts accordingly.
Use structured data like user demographics (age, gender, location) to target advertisements effectively on platforms like Facebook.
Unstructured Data: The Challenge of Social Media Analysis
Contrastingly, unstructured data is the vast, unorganized information collection that doesn’t fit neatly into predefined categories. It includes text posts, images, videos, and comments – the essence of what makes social media ‘social.’ Analyzing unstructured data requires more complex algorithms and sophisticated processing techniques, such as natural language processing (NLP) and image recognition.
One example of leveraging unstructured data is sentiment analysis, where algorithms assess the tone and emotion in user posts and comments to gauge public opinion on a topic or brand. For instance, a company might use sentiment analysis to monitor customer feedback on social media, gathering insights into the public’s perception of their products or services.
Semi-Structured Data: Bridging the Gap
Semi-structured data in social media is the middle ground between the rigidity of structured data and the fluidity of unstructured data. It’s not entirely organized into a predefined model, but it’s not entirely without structure. Examples include emails, which have a structured header (To, From, Subject) but an unstructured body, or social media posts, which have defined fields (username, post date) but also contain unstructured elements (the content of the post).
A practical application of semi-structured data analysis in social media is hashtag usage. Hashtags are a form of semi-structured data used within the unstructured context of a post but follow a specific format and serve as a categorizing tool. Analyzing hashtag trends can provide insights into popular topics, user engagement, and the spread of information on platforms like Twitter and Instagram.
Exploring the Nature of Social Media Data
Navigating the digital landscape of social media, one encounters a diverse and rich array of data, each offering a glimpse into the vast tapestry of human interaction and communication. The nature of social media data is as varied as the users who create it, encompassing a wide range of content types, engagement patterns, and underlying sentiments.
User-Generated Content: The Pulse of Social Media
User-generated content (UGC) is the lifeblood of social media platforms. It encompasses everything users create and share, from simple text posts and comments to images, videos, and memes. This content reflects the users’ thoughts, feelings, opinions, and creativity. UGC is not just a form of expression but also a source of valuable data. For instance, a trending hashtag on Twitter can offer real-time insights into public opinion on a current event or social issue. At the same time, Instagram posts can reveal emerging lifestyle and fashion trends.
Table: Examples of User Generated Content
| Types of UGC | Description | Potential Uses | Challenges in Analysis | Strategic Benefits |
|---|---|---|---|---|
| Text Posts & Comments | Written content shared by users on platforms like Twitter, Facebook. | Analyzing sentiment, gauging public opinion, identifying trends. | Context interpretation, sarcasm, and nuanced language understanding. | Gaining insights into consumer attitudes, tailoring communication strategies. |
| Images & Videos | Visual content uploaded by users on platforms like Instagram, YouTube. | Brand engagement analysis, visual trend identification. | High data volume, need for advanced image/video analysis tools. | Enhancing brand visibility, understanding visual preferences of audience. |
| Memes | Creative, often humorous content that is rapidly shared. | Tracking viral trends, understanding cultural sentiments. | Rapid evolution, contextual relevance, varied interpretations. | Engaging with cultural trends, creating relatable brand content. |
| Hashtags | User-created tags used to categorize content on social media. | Trend monitoring, event or campaign tracking. | Keeping up with rapidly changing trends, hashtag spam. | Targeting specific topics, measuring campaign reach and impact. |
| Customer Reviews & Feedback | Direct user opinions on products/services, shared on various platforms. | Service improvement, customer satisfaction analysis. | Volume of data, managing negative feedback constructively. | Enhancing product/service quality, building customer trust and loyalty. |
Analyzing UGC allows businesses and organizations to tap into the collective consciousness of their audience. For example, a brand might analyze customer reviews and feedback on social media to gauge satisfaction levels and identify areas for improvement. Similarly, a political campaign might monitor social media discussions to understand voter concerns and sentiments. UGC’s dynamic and spontaneous nature makes it a rich resource for anyone looking to understand and engage with their audience on a deeper level.
The Value of Social Media Analytics
The true power of social media data lies in the ability to analyze and interpret it effectively. Social media analytics involves applying statistical and machine learning techniques to uncover patterns, trends, and insights within the data. This analysis can range from simple metrics like engagement rates and follower growth to more complex analyses like sentiment analysis and predictive modeling.
The value of social media analytics is evident in its wide range of applications. It can mean the difference between a successful paid media campaign and a missed opportunity for marketers. By analyzing engagement data, they can identify the most effective content types and posting times, tailoring their strategy for maximum impact. In customer service, analytics can track response times and sentiment, ensuring customer concerns are addressed promptly and effectively.
Moreover, social media analytics can also be vital in crisis management. By monitoring social media conversations, organizations can quickly identify and respond to negative sentiments or misinformation, mitigating potential damage to their reputation.
Five-Step Process for Social Media Analysis: A Structured Approach
Social media analysis, in its essence, is a structured process that encompasses various stages, each crucial for transforming vast swathes of data into meaningful data-driven insights. This systematic approach is not merely a linear progression but an interplay of techniques and methodologies that coalesce to form a comprehensive understanding of the social media landscape.
Table: A Structured Approach to Social Media Analysis
| Step | Description | Tools & Techniques | Challenges | Strategic Objectives |
|---|---|---|---|---|
| Designing Research Analysis | Setting clear objectives and defining the scope of the study. | SWOT Analysis, Objective-Setting Frameworks | Aligning goals with available data, ensuring objectives are measurable | To establish a clear, focused framework for analysis, aligning with business or research goals. |
| Data Collection | Gathering relevant social media data based on the defined objectives. | Social Media Monitoring Tools (e.g., Hootsuite, Brandwatch), APIs, Surveys | Ensuring data relevance and quality, data privacy concerns | To collect high-quality, relevant data that provides the foundation for meaningful analysis. |
| Data Mining | Extracting actionable information from the collected data using algorithms. | Text Analytics Tools, Machine Learning Models, Data Mining Software | Handling large data volumes, ensuring accuracy in pattern recognition | Identify patterns, trends, and relationships within the data that are not immediately apparent. |
| Data Analysis | Interpreting the data to draw meaningful conclusions. | Statistical Analysis Software, Sentiment Analysis Tools | Integrating diverse data sets, avoiding misinterpretation of data | To translate data into actionable insights, providing answers to the research questions. |
| Data Visualization | Presenting the analyzed data in an understandable and engaging format. | Visualization Tools (e.g., Tableau, PowerBI), Infographics | Creating clear, impactful visualizations that accurately represent data | To make complex data accessible and actionable for decision-makers and stakeholders. |
Step 1: Designing Research Analysis
The first and most critical phase of any social media data analysis is the foundational design of the research and analytical approach. This stage establishes the objectives, metrics, data types, and methodologies guiding the entire process.
Defining sound research design is essential – it determines precisely how the analysis will be executed and what insights it will uncover. For instance, a company seeking to evaluate brand sentiment after a major product launch needs to delineate specific metrics of interest – such as changes in engagement rates, sentiment scores, audience growth figures, and share of voice.
To assess these metrics properly, the company must also determine appropriate data sources, collection tools, and analytical models. This may involve scraping relevant social content, conducting sentiment analysis on textual data, analyzing changes in audience demographics, employing predictive analytics models, and more.
Step 2: Data Collection
The data collection process is far more strategic than simply amassing vast volumes of information. It requires carefully selecting sources and tools to harvest data relevant to the defined research objectives.
For instance, a study focused on gathering customer service feedback would prioritize mentions from Twitter, Facebook comments, and review platforms. The goal is not to indiscriminately aggregate data but to purposefully capture insights tied to the goals of the analysis. This stage demands a meticulous examination of potential data sources and the development of customized extraction techniques for each.
The process involves:
- Mapping out specific platforms and accounts where relevant data resides based on the target audience and objectives.
- Evaluating APIs, scraping tools, social listening platforms, and other data access options.
- Testing extraction tools and approaches to confirm they collect the required data types.
- Constructing queries, scrapers, listeners, and pipelines tailored to the research goals.
- Implementing customized data collection workflows capable of acquiring targeted social data at the needed cadence.
- Continually monitoring data streams for relevance, quality, and alignment with objectives.
- Adjusting collection tools and techniques as required to maintain data integrity.
The relevance and quality of collected data profoundly impact the integrity of the subsequent analysis. Poor data leads to inaccurate models, metrics, and conclusions. Consequently, ensuring the data-gathering process aligns with defined research goals is essential. This emphasis on strategic collection provides the foundation for impactful analysis and actionable insights.
Step 3: Data Mining
If data collection builds the foundation, data mining assembles the framework by transforming raw data into analyzable, structured datasets. Advanced algorithms and analytical techniques unravel the intricacies within social data to extract meaningful patterns and trends.
For example, text analytics may be deployed to identify themes and extract insights from user comments. Machine learning models can segment target audiences based on social engagement patterns. Network analysis visually maps connections and interactions between users.
Key data mining techniques include:
- Text analysis to identify themes, topics, sentiment, and semantics.
- Predictive analytics leveraging ML algorithms to classify users, forecast outcomes, and reveal correlations.
- Social network analysis to map relationships and information flows between users.
- Trend analysis to uncover temporal patterns and trajectory of key metrics.
- Statistical modeling to quantify engagement, determine sentiment, and support data-driven decisions.
- Data fusion to integrate diverse data types and sources into unified datasets.
The power of data mining lies in its capacity to transform immense volumes of complex, unorganized social data into computable, insightful information aligned with business objectives. The techniques involved parsing the ambiguities within raw data to extract its most valuable attributes.
Step 4: Data Analysis
Data analysis represents the crux of social media analytics, distilling insights that align with the initial research objectives. This stage demands a rigorous, critical approach to interpreting the assembled datasets and evaluating the implications of underlying patterns.
The analysis may take many forms based on the goals defined during the research design. Sentiment analysis can quantify consumer perception, while trend analysis reveals shifts in engagement over time. Network analysis maps interaction patterns between users and influencers. Demographic analysis of social data provides audience segmentation. Careful attention must be paid to performing multifaceted analyses tailored to the research goals.
For a product launch, this may encompass:
- Sentiment analysis to assess consumer feedback surrounding new features. Positive sentiment suggests a favorable reception.
- Engagement analysis to evaluate changes in interaction rates, clicks, and shares relative to previous campaigns. Increased engagement implies growing interest.
- Demographic analysis to determine if the launch reached the target customer segments based on social analytics profiles.
- Trend analysis to identify changes in uptake and engagement over the launch period. Accelerating trends signal positive momentum.
The depth and scope of analytical techniques directly impact the relevance of the insights uncovered. Just as crucial is analytically evaluating results to derive meaningful, actionable conclusions instead of merely observing data patterns. The data analysis stage represents the unveiling of the coveted social insights – but thoughtful interpretation is requisite to extract their true value.
Step 5: Data Visualization
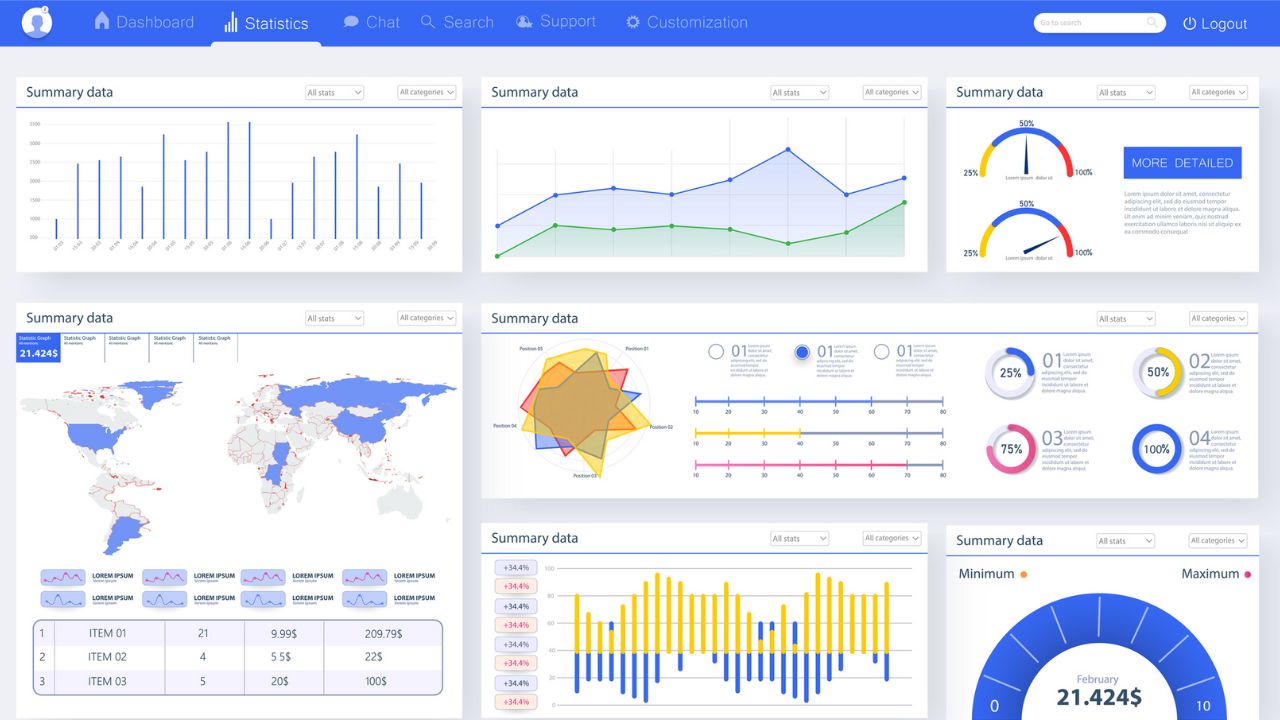
The final phase of social media analysis involves transforming the culled data into intuitive narratives via impactful visualizations. This goes beyond basic graphical representation – effective visualization artfully conveys complex findings through engaging, interactive mediums.
Strategic visual storytelling makes the analysis accessible and compelling to diverse audiences. Interactive dashboards allow customizable views for different stakeholders. Heat maps visualize engagement levels by geography. Powerful infographics synthesize key trends and patterns.
Well-designed visuals should provide clarity without compromising nuance – highlighting core insights without obscuring important details. Visual elements like colors, layouts, and charts should be selected intentionally to accentuate significant patterns and facilitate comprehension.
Yet data visualization involves more than just aesthetic appeal. Visual elements must authentically represent the underlying data. Design choices that misconstrue or exaggerate the analysis undermine trust in the insights. Integrity in the data is imperative.
When executed successfully, data visualizations unlock a wider understanding of social media analysis while readily conveying complex findings to any audience. The visualization process crystallizes the narrative about the data’s meaning and implications – transforming insights into actions.
In-Depth Analysis of Social Media Data Reports
In the intricate world of social media analytics, creating various types of reports is crucial for interpreting and communicating the vast amounts of data users generate. These reports help measure social media strategies’ effectiveness and provide actionable insights for future endeavors.
Social Media Scorecards: Tracking Holistic Performance
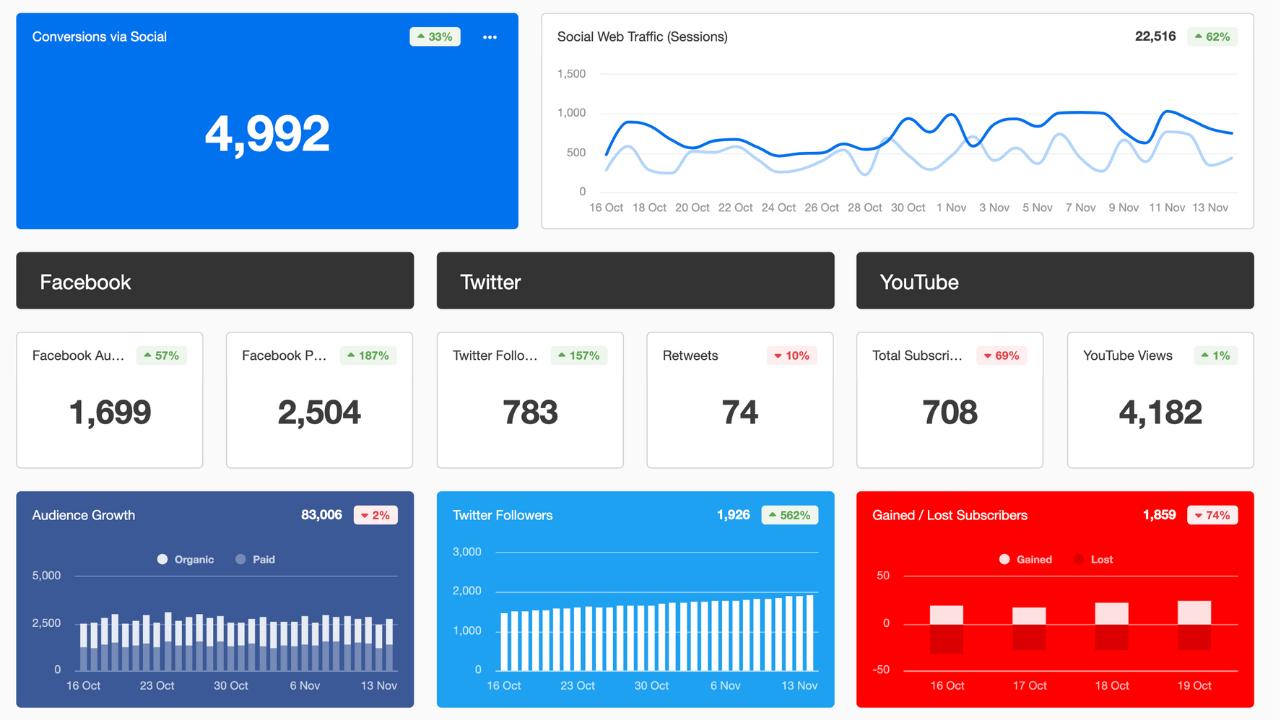
Social Media Scorecards are comprehensive reports that overview an organization’s social media performance across various platforms. These scorecards typically include key performance indicators (KPIs) such as follower growth, engagement rates, and reach. The utility of a social media scorecard lies in its ability to give a birdseye view of social media health and progress.
For instance, a company might use a scorecard to track its monthly performance on platforms like Facebook, Twitter, and Instagram. The scorecard could reveal that while the company’s Facebook page shows steady growth in followers, its Twitter account experiences higher engagement rates. Such insights enable businesses to decide where to focus their efforts and resources.
Creating an effective social media scorecard requires the selection of relevant KPIs and a deep understanding of what each metric signifies in the context of broader business goals. It’s not just about tracking numbers; it’s about interpreting them to align with the organization’s objectives and strategies.
Social Media Campaign Performance: Measuring Specific Initiatives
In contrast to the broad overview provided by scorecards, Social Media Campaign Performance Reports offer a detailed analysis of specific marketing campaigns or initiatives. These reports delve into the nitty-gritty of campaign effectiveness, examining aspects such as conversion rates, click-through rates, and audience engagement specific to a campaign.
For example, a retail brand launching a new product might use a campaign performance report to analyze the impact of its promotional hashtag on Instagram. The report could track the number of hashtag posts, user engagement with these posts, and the resulting traffic to the product’s webpage. Such detailed analysis measures the campaign’s success and provides insights into audience behavior and preferences.
Effective campaign performance reports often involve a blend of quantitative data, like engagement metrics, and qualitative insights, such as audience sentiment. They enable marketers to fine-tune their strategies, optimize future campaigns, and better understand the ROI of their social media efforts.
Social Media Scorecards and Campaign Performance Reports are vital tools in social media analytics. They offer different lenses through which to view and understand the complex world of social media, providing valuable insights that drive strategic decision-making and optimize digital presence.
Maximizing Brand Engagement Through Social Media Data Insights
In today’s digital era, social media has become a pivotal arena for brands to engage with their audiences. The power of social media data in enhancing brand engagement cannot be overstated. It offers a treasure trove of insights that can transform how brands interact with their customers, respond to trends, and position their content.
Informing Engagement Strategies with Data-Driven Insights
The strategic use of social media data is key to developing effective engagement strategies. This data offers a real-time pulse on consumer preferences, behaviors, and sentiments, enabling brands to tailor their engagement tactics accordingly. For example, a beauty brand might analyze social media conversations to identify emerging skincare trends. By understanding what ingredients or product types are gaining traction, the brand can adjust its messaging and product development to align with these trends.
Furthermore, social media data can reveal the best times to post, the types of content that resonate with the audience, and the platforms where their target demographic is most active. For instance, a brand might find that its audience engages more with video content on Instagram than text posts on Twitter. This insight allows for a more focused strategy, ensuring that resources are allocated to creating content that will likely generate the most engagement.
Prioritizing Content and Media for Maximum Impact
Another critical aspect of leveraging social media data is content and media prioritization. Brands can use data analytics to identify which types of content drive the most engagement and conversions. This could range from user-generated content and influencer partnerships to different forms of multimedia such as images, videos, or blogs.
A compelling example is how a travel company might use social media analytics to determine that its audience prefers real, user-generated travel stories over polished advertisements. Armed with this knowledge, the company can prioritize sharing user-generated content on its platforms, thus fostering a more authentic connection with its audience.
Media prioritization also involves understanding which social media platforms are most effective for different types of content. A fashion brand, for example, might leverage Instagram for visual storytelling and Pinterest to drive traffic to its latest collections.
The power of social media data in brand engagement lies in its ability to offer nuanced, actionable insights. These insights enable brands to craft data-informed engagement strategies and content prioritization that align with their audience’s evolving preferences and behaviors.
Integrating Social Media Analysis with Traditional Survey Data
The landscape of data analytics in understanding consumer behavior and preferences is vast, encompassing various methodologies. Among these, social media analysis and traditional survey data stand out as two pivotal sources of information. While they are often viewed as distinct or competing sources, the truth lies in their complementary nature.
The Complementary Nature of Social Media and Survey Data
Social media analysis and traditional survey data are often considered separate entities, each with unique strengths and limitations. However, if combined, they provide a more comprehensive understanding of consumer behaviors and attitudes. Social media data offers real-time, organic insights into consumer sentiment and trends. It reflects users’ unfiltered opinions and discussions, presenting a raw, unstructured view of public perception.
On the other hand, survey data provides structured, quantitative insights. Surveys can be designed to gather specific information directly from the target audience, offering clarity and depth on particular topics. For example, a retail brand could use social media analysis to observe the general sentiment about a new product launch, identifying common themes and topics in consumer discussions. Concurrently, the same brand could deploy a targeted survey to gather detailed feedback on specific aspects of the product, like its pricing, features, or packaging.
A brand can better understand its audience by integrating social media and survey insights. This dual approach allows for the cross-validation of findings, leveraging the spontaneity and breadth of social media with the precision and depth of surveys.
Enhancing Performance and Optimization in Social Analysis
Integrating social media analysis with survey data can significantly enhance the performance and optimization of marketing strategies and consumer research. Social media analysis can guide the development of survey questions, ensuring they are relevant and timely. It can also help identify gaps in consumer understanding that surveys can explore in greater detail.
Furthermore, the feedback from surveys can inform social media strategies. For instance, if survey results indicate a gap in customer understanding of a product’s features, a company might launch an informational social media campaign to address this.
Combining these data types in performance measurement and optimization allows for a more robust assessment of marketing campaigns and brand strategies. Businesses can gauge its effectiveness and make data-driven adjustments by analyzing social media reactions and survey responses to a campaign.
Ethical Considerations in Social Media Data Analysis
| Consideration | Description | Potential Risks | Best Practices | Legal Implications |
|---|---|---|---|---|
| Privacy Concerns and User Consent | Involves ensuring that user data is collected and used in a manner that respects individual privacy rights. | Unauthorized data access, Breach of user trust | Obtaining explicit consent, Implementing robust data security measures | Compliance with regulations like GDPR, CCPA |
| Balancing Data Utility with Ethical Practices | Refers to the challenge of maximizing data use for business insights while adhering to ethical standards. | Misuse of sensitive data, Ethical dilemmas in data interpretation | Establishing clear ethical guidelines, Regular ethics training for data handlers | Legal repercussions for unethical data use, Industry standards |
Future Trends in Social Media Analytics
The dynamic world of social media analytics stands at a pivotal juncture, driven by rapid technological advancements and shifts in user behavior. As we gaze toward the future, it becomes increasingly apparent that the field is set for a profound transformation. This transition, marked by the emergence of new technologies and platforms, is not just a shift in tools and techniques but a fundamental rethinking of how social media data is collected, analyzed, and interpreted.
Additionally, the evolution of the social media landscape promises to reshape how businesses and individuals interact with these platforms. Let’s delve deeper into these emerging trends to understand their potential impact and potential opportunities.
The Onset of Revolutionary Technologies in Social Media Analytics
At the forefront of this transformation are emerging technologies that promise to augment our capacity to decipher the vast and complex datasets generated by social media users. Artificial Intelligence (AI) and Machine Learning (ML) lead this charge, offering sophisticated data processing capabilities far exceeding traditional methods. These technologies enable more nuanced sentiment analysis, trend detection, and predictive analytics, all essential in a landscape that thrives on real-time information.
Consider the implications of AI in understanding user behavior. AI can sift through millions of social media posts, identifying emerging trends and sentiments with precision and speed unattainable by human analysts. This capability isn’t just about processing power; it’s about the ability to uncover insights that would otherwise remain hidden in the enormity of data.
Machine Learning algorithms, for instance, can predict consumer behavior patterns, enabling businesses to anticipate market shifts and respond proactively.
Predictive Analysis: Shaping the Future of the Social Media Landscape
As we contemplate the future of social media analytics, it’s crucial to consider the technologies that will drive it and the changes these technologies will bring to the social media landscape. The integration of predictive analysis tools is set to play a pivotal role in this evolution. Predictive analysis, powered by AI and ML, has the potential to transform the way businesses and marketers approach social media strategy.
These tools don’t just analyze past and present data; they predict future trends, offering a forward-looking perspective that is invaluable in a rapidly changing digital world. For example, predictive models could anticipate the rise of new social media platforms or changes in user engagement patterns, allowing businesses to adapt their strategies in advance. This proactive approach to social media strategy, grounded in predictive analysis, will be a game-changer, offering businesses a significant competitive advantage.
As we look towards the future of social media analytics, it’s evident that the field is poised for significant changes. The advent of advanced technologies like AI and ML and the growing importance of predictive analysis will redefine how we collect, analyze, and act upon social media data. These changes promise to enhance our analytical capabilities and offer deeper insights into the evolving landscape of social media.