Thank you for the content collaboration platforms that exist today. I tried and forgot the early days of the Internet when my colleagues would send 50MB (or more) emails on a slow network causing my PC to freeze. The blue screen of death, Ctrl+Alt+Del, and then losing saved files was a common scenario in my life. And for the highly impatient, easily agitated A-D-D person I am, this was never, ever a good thing.
What are content collaboration platforms?
Content collaboration platforms provide a central location for team members to share and collaborate on content. These platforms typically offer a variety of features that make it easier for teams to work together, such as the ability to comment on and edit documents in real-time, assign tasks to specific team members, and track changes over time. Content collaboration platforms can be used for various purposes, such as managing website content, developing marketing materials, or creating presentations.
Several content collaboration platforms are available, each with unique features and capabilities. Some popular options include Google Drive, Dropbox Paper, and Quip. Choosing the right platform for your team will depend on your specific needs and requirements.
The content collaboration space used to be Enterprise File Sync and Share (EFSS). Try saying that five times quickly. Thank you, Gartner, for the name change and for making it easier for us. I have used most of these vendors throughout my career, both for personal and professional use, and I have my favorites, but we’ll save that for another post.
As a part of a Data Science class I am taking, I wanted to analyze an audience that was more challenging to find than some of the other audiences I have explored in the past. So I decided to focus on a space I was familiar with from a user’s perspective. Not very sexy … file storage, collaboration, blah, but it’s essential for companies and their employees today.
I first started by researching the content collaboration category in general. Gartner is always an excellent place to start – see Magic Quadrant for Content Collaboration Platforms. Unless you have 2 G’s, you can skim through reprints of the analysis published on several category leaders’ websites. Doing this helped me prepare my approach.
I first looked at the coverage for the last 12 months to understand how the media was writing about content collaboration. I also looked at several vendors to see how they described their solutions on their websites and social content. I used this language to build a taxonomy of keywords to inform bio and content searches. I filtered out spammy accounts, people who weren’t active on social in the last six months, brands, and industry associations. Since I am looking just for people, my audience size was 2.2K but consisted of 15.7M conversations from June 1, 2017, to June 1, 2018.
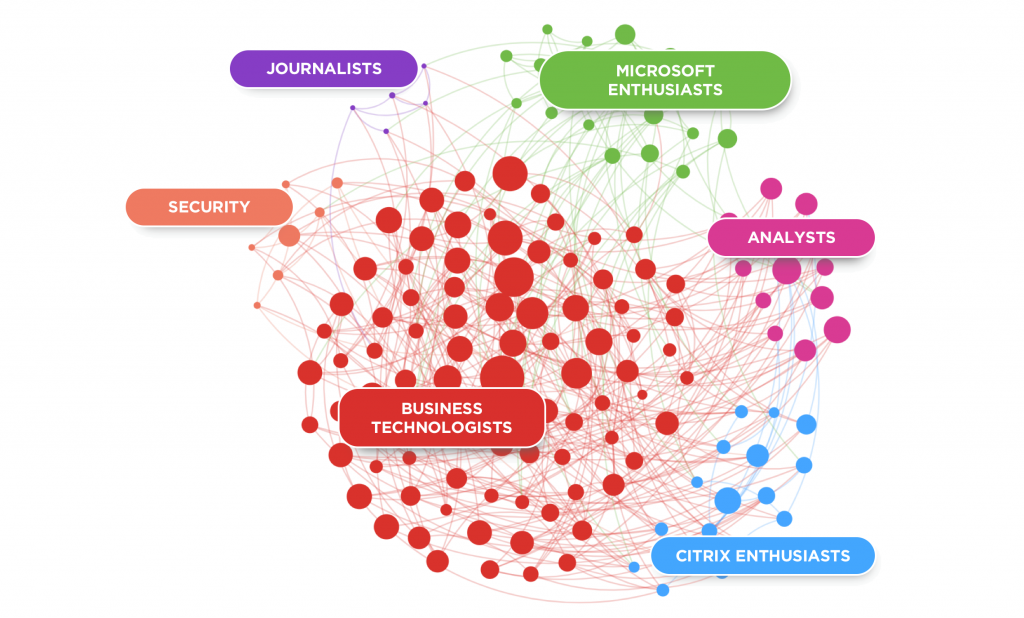
I wanted to understand who the buyers were, who was writing about the topic in the media, and the analysts, influencers, and general brand ambassadors passionate about the space, so I uploaded the audience to one of my favorite platforms, Audiense. Below, you can see the clustered sub-segments. The size of the clusters represents how large the audience is and how they are connected. Interesting to see that a few segments are broken down by two content collaboration vendors–Microsoft and Citrix. There’s a reason for this, addressed below. Keep reading.

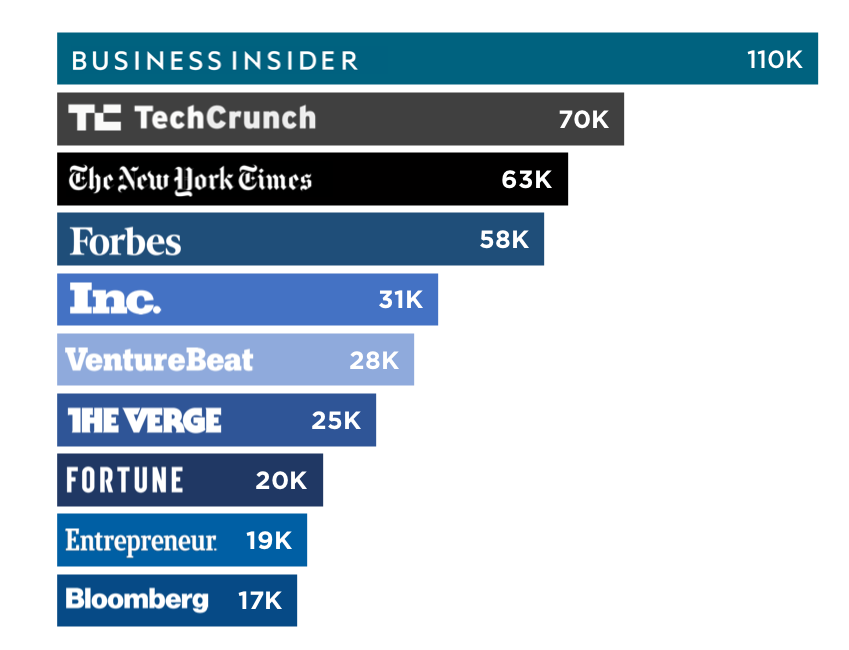
From there, I drilled down to see what interests and characteristics were unique to the audience and how each sub-segment compared to the larger group. This led to filtering out their media consumption habits, so I could understand where they go to consume news. Below, you’ll see which media resonates collectively with the entire audience. The data represents mentions and shares over the last 12 months, with Business Insider leading the way, followed by TechCrunch, The New York Times, and then Forbes.

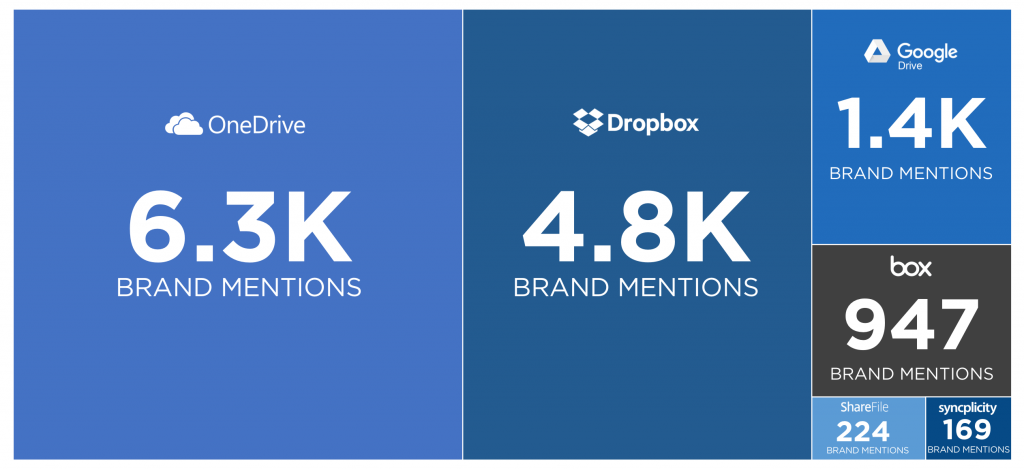
Then I got curious. I wanted to know which content collaboration vendors were being discussed by the audience the most and in what context. I only focused on the Magic Quadrant category leaders, specifically Box, DropBox, OneDrive, Google Drive, Citrix Sharefile, and Syncplicity. But there’s a slight caveat. If you go back and look at the above segments, you’ll see a reasonably large “Microsoft Enthusiasts” sub-segment, many of which are employees and Microsoft MVPs, which taints the below data. And to be fair, the CEO of Box is also a part of the audience I analyzed, and he talks/shares quite a bit about Box.

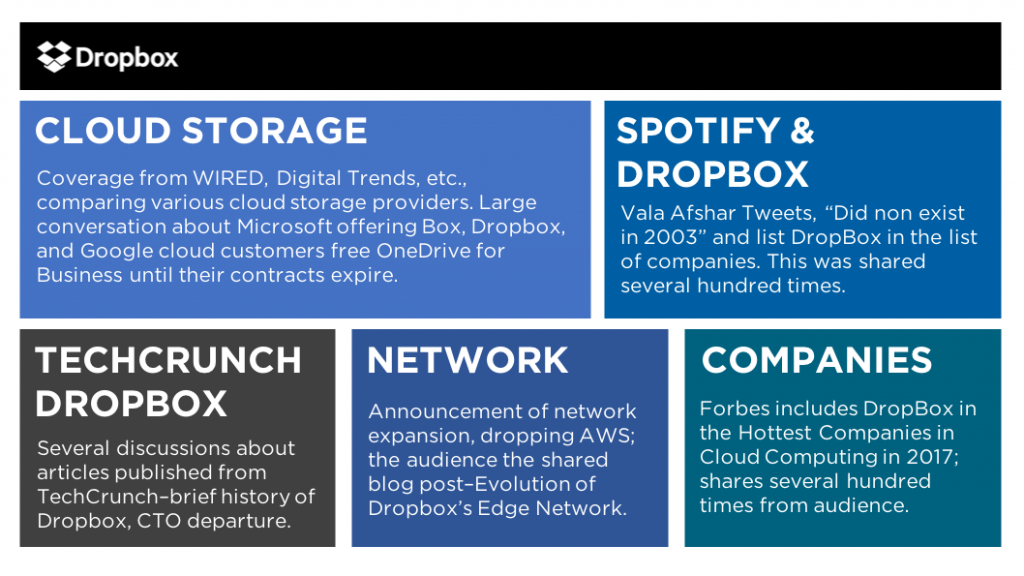
To take it one step further, I looked at the conversation surrounding DropBox. Below you’ll see the topical conversational volume from this audience. The larger the boxes, the larger the conversation. The data is collected based on keywords, language, hashtags, and content (URLs) shared. It’s interesting to see what’s top of mind for the audience, and drilling down into this data will undoubtedly lead to some significant insights.

So what’s next?
Well, it depends on what you do. If you work in PR, this data is gold. If you manage content, you’ll have to do more work and deep dive into the unbranded conversation. Doing so can uncover whitespace that can inform a new narrative and your B2B content strategy, editorial approach, or creative campaign. If you work in social, you can use this data (but in real-time) and create trending content with the audience.
Good luck.
Here are some additional analyses on various topics as a part of the data science class I am taking on Udemy. Please let me know if you have any questions or comments. You can find me on Twitter or LinkedIn.
