You can’t just flip a coin and choose which media outlet you want to pitch. Well, you can, but I would recommend against it.
Why this matters:
It matters because you’d be guessing, and hope is not a strategy. The good news is that you can use data to identify topically relevant news outlets.
It seems like a fundamental question but one that should be asked. I have found in my career that it’s always a good practice to level set on the basics at the very beginning of every conversation. In this case, it’s content. Plus, some people who read this blog don’t work in public relations, and I wouldn’t expect them to know the definition of a media outlet.
We consume content from newspapers, magazines, radio, television, podcasts, and more daily. This is how we keep up with recent events, the news, stocks, investments, or what’s happening in our communities. These are all media outlets.
What is a Media Outlet?
A media outlet is a company. Website. Television station. Magazine. It’s a program that provides news and information about various topics. It could be breaking news in politics, business, or worldwide events.
Consumer media publications focus on fashion, travel, gaming, and food. Business media outlets focus on mergers and acquisitions and financial and economic news. Tech media outlets focus on startups and innovation. There are conservative media outlets, liberal media outlets, black media outlets, and local news media, and the list can go on for basically … forever.
Brands can be media outlets too.
What is Meant by “Top Media Outlet”?
I don’t know how many times in my career I have heard, “Hey Brito, can you send me a list of the #1 consumer media outlet for client X?”
I usually follow up with this series of questions to better understand the goals and objectives, and I typically ask what they mean by “top media.” A top news media outlet can be defined in so many different ways. I won’t get into the back-and-forth conversations, but I will say that the industry is ripe for growth and can be fueled with data. By applying rigor and a formula for analysis, questions like this wouldn’t be too difficult to answer.
Let’s walk through some examples and make some assumptions along the way.
How to Analyze Media Outlets
This example isn’t about measuring the performance of an earned media campaign. This is about understanding the media landscape to make smarter decisions when prioritizing your PR program and pitching the media. This happens before the pitching begins.
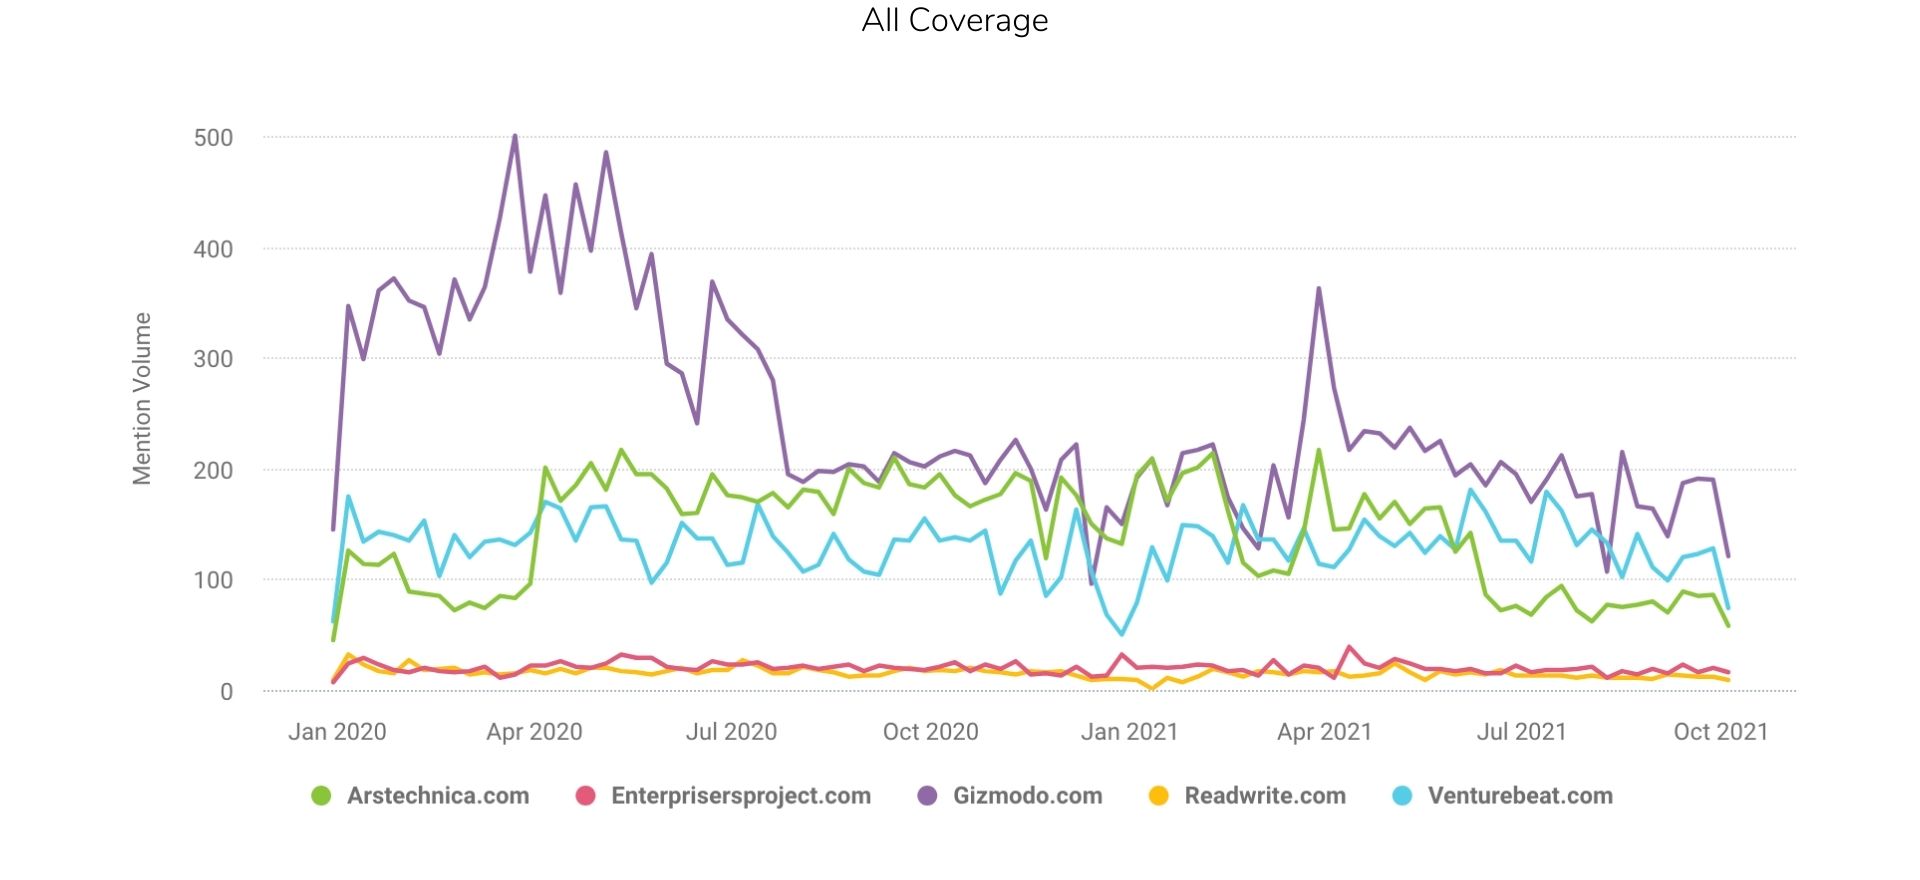
We’re looking at five tech media pubs in the below data set–ArsTechnica, and VentureBeat. The trend line represents the total volume of articles published since January 2020. Gizmodo started 2020 extremely strong by reviewing the data, and publishing between 300 and 500 articles monthly. The decline happened shortly after the pandemic and has remained flat.
Looking at one media outlet in isolation isn’t insightful, so let’s move on.
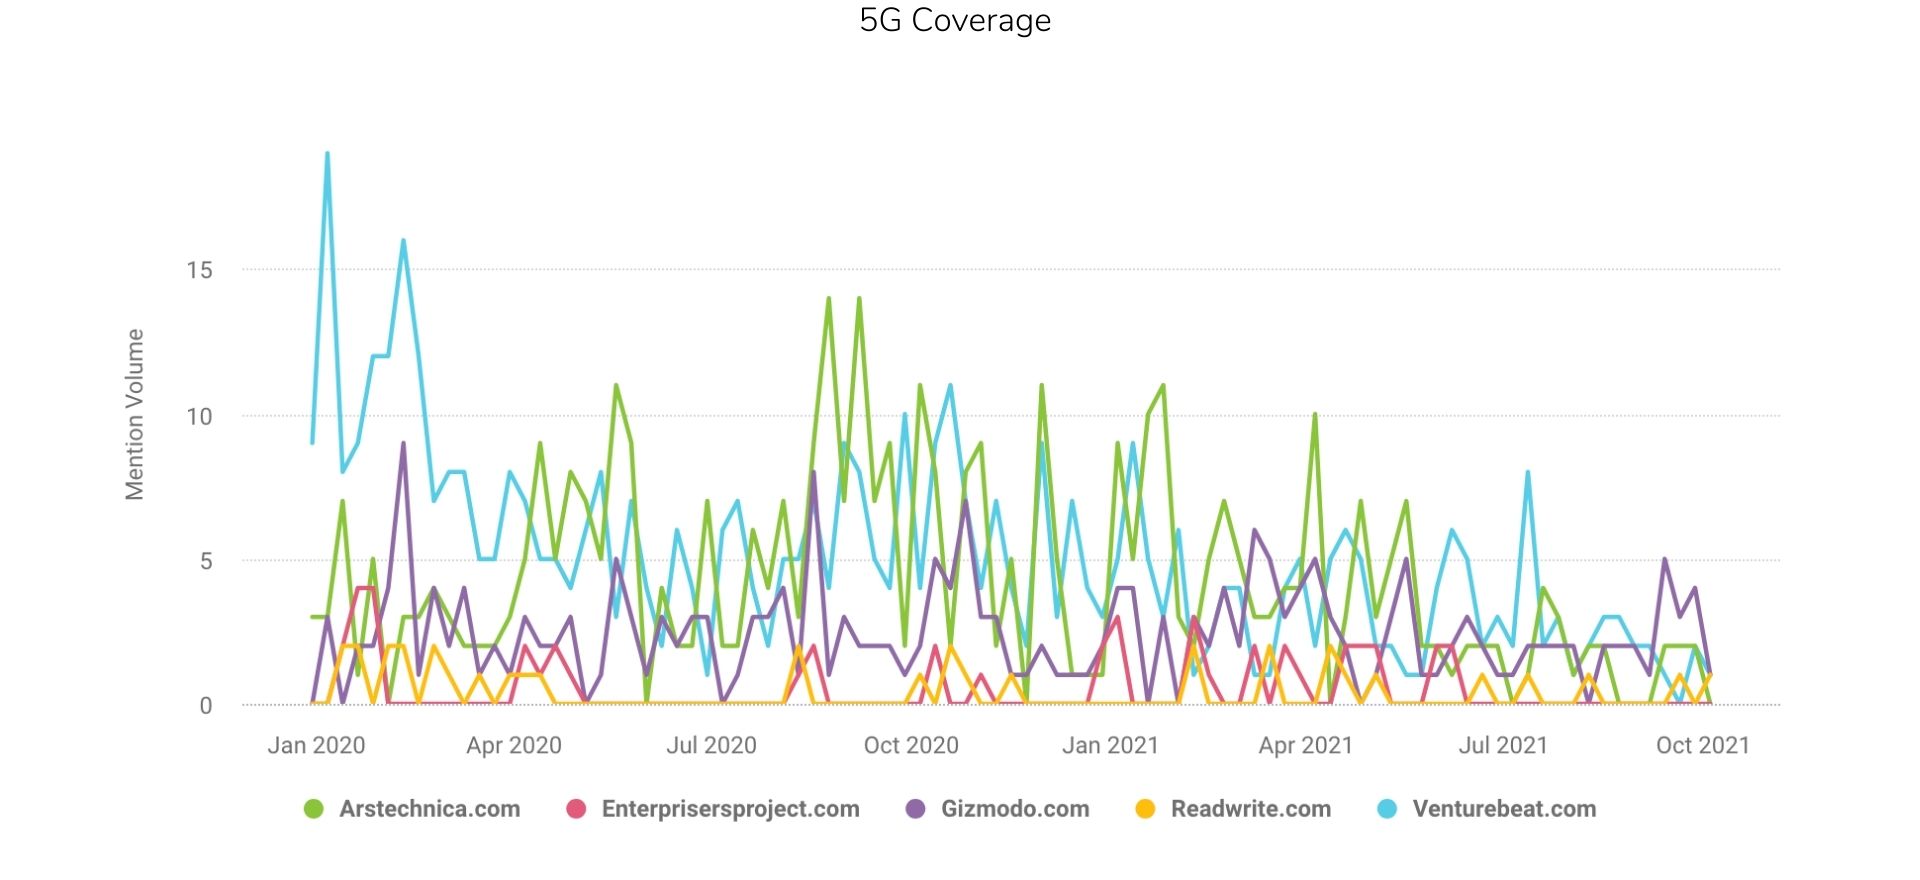
In the below example, we’re now introducing topics and narratives. Of those five tech news media pubs, this tells us which write the most about 5G. We’re not necessarily looking at total articles during that time frame but more about the patterns in media coverage since the beginning of January 2020.
The data below tell us that VentureBeat was covering 5G more at the beginning of 2020 than in the last three to six months. It’s been sporadic ever since. On the other hand, ArsTechnica started 2020 with minimal coverage of 5G but has since increased the volume of 5G coverage over time.
This tells me a few different things. 5G is less relevant to VentureBeat than it used to be. 5G has become more relevant to ArsTechnica. Or, perhaps 5G, as an innovative technology or topic of discussion, is just losing media relevance.
Perhaps the media was shifting to the next big thing for a minute. Maybe there would be a focus more on 6G than 5G. Since January 2020, there have been 17 6G-related articles published in these five media pubs. There were 1,186 articles published about 5G from the same data set for context.
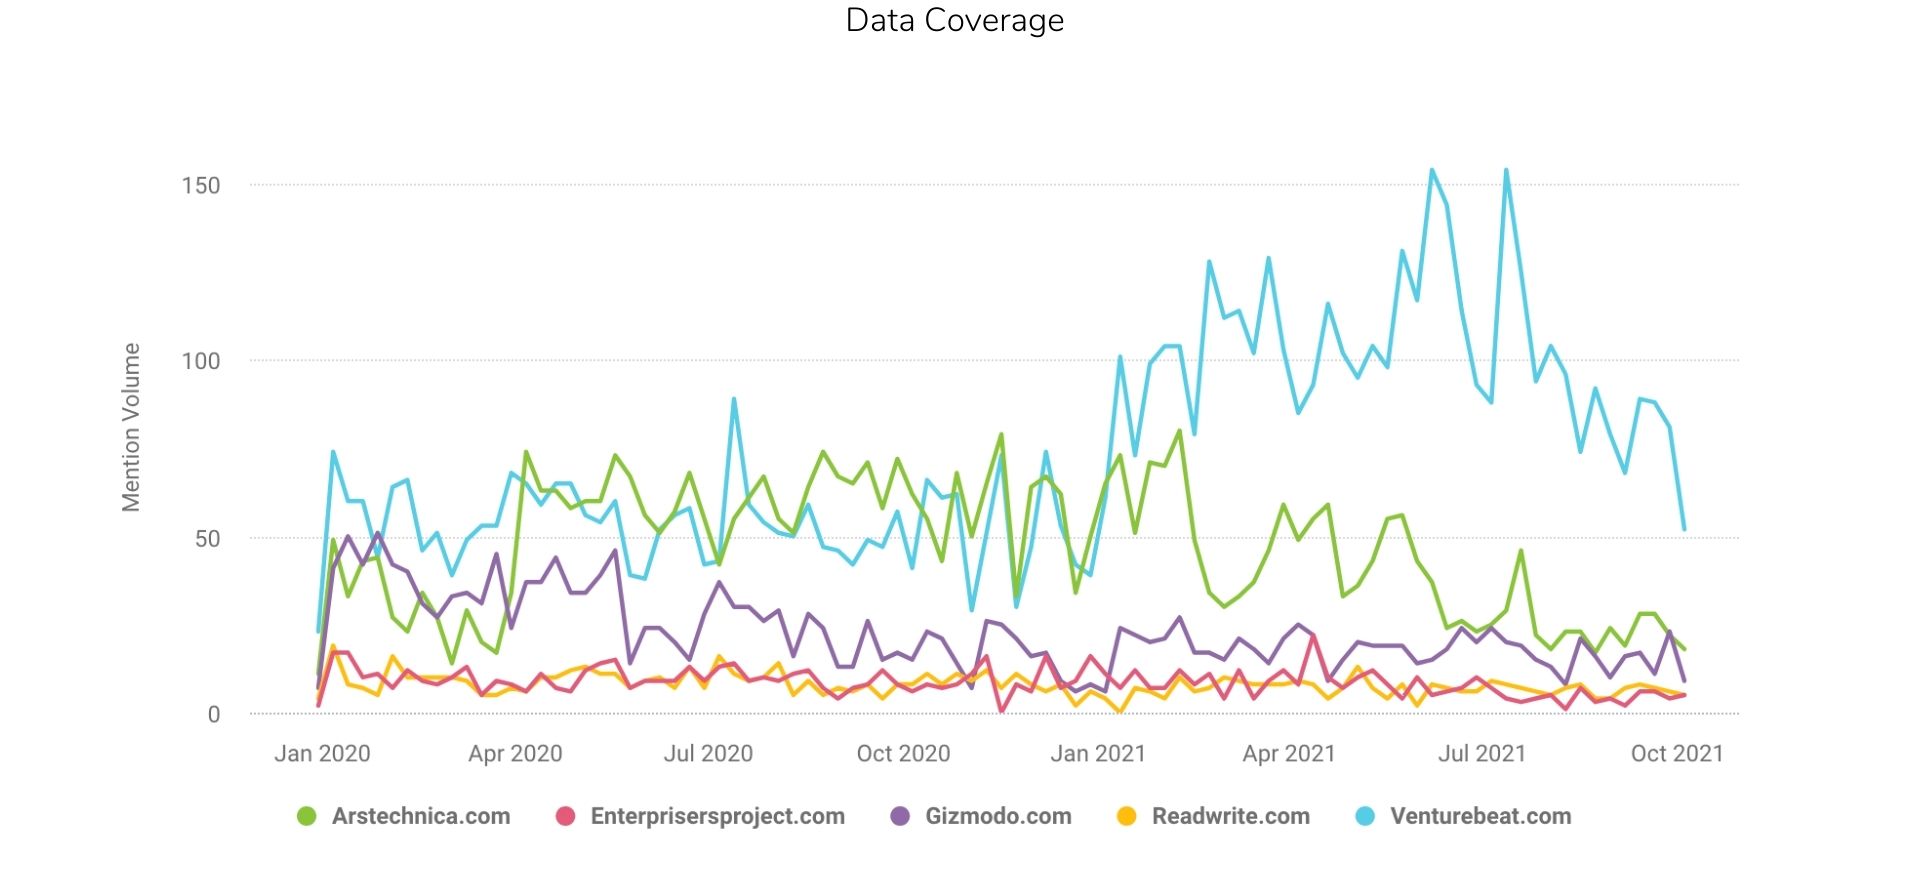
To change it a little, I wanted to explore another coverage topic within this data set, in this case, well … data. Below is news coverage of data from these top five media pubs.
It’s fascinating if you look at this data. Both ArsTechnica and VentureBeat are trending but doing so in different directions. It’s also important to note that Gizmodo has decreased slightly over the last 20 months. Their month-to-month volume is also significantly lower.
We can hypothesize why this data is the way it is all day. But business, economics, and audience factors come into play in this data. This is something we are not going to get into in this post.
The news media examples above show the publishing trends over a period of time. As mentioned, there are a lot of variables that go into what stories get published and why. So taking the above data into context, I wanted to illustrate the value of media coverage analysis and how it can become actionable for your business.
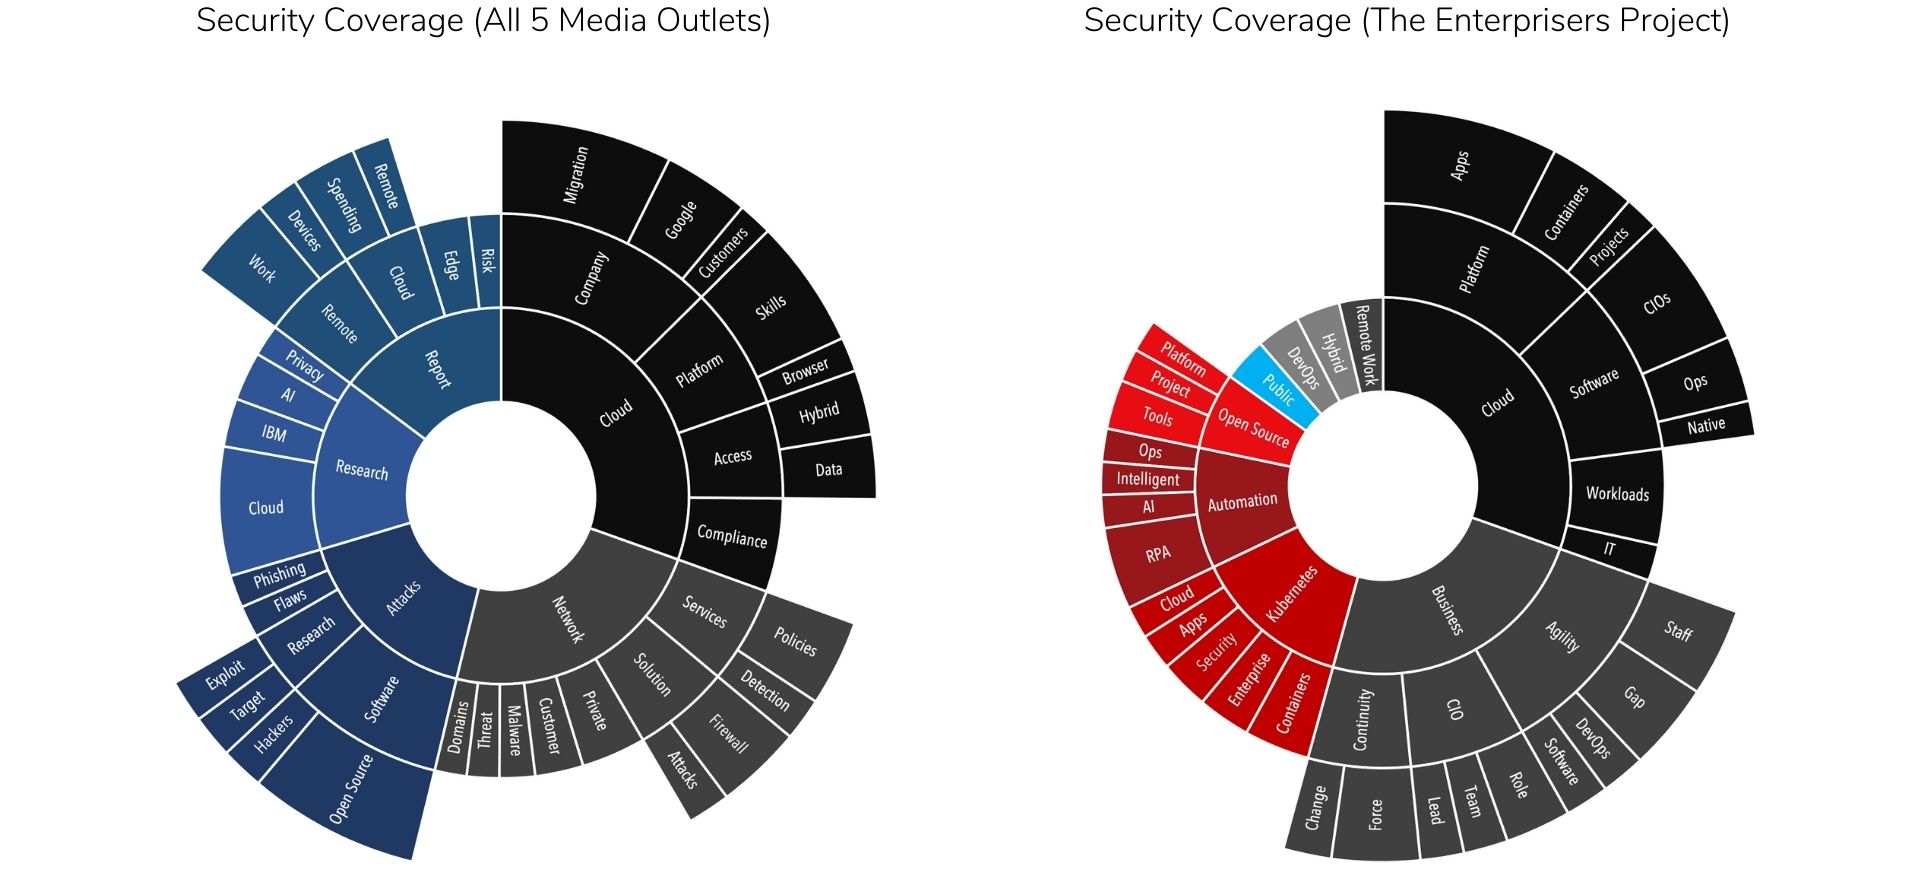
There are two charts below that represent similar insights. The chart on the left analyzes all the security coverage across the five media pubs we have discussed. The chart on the right illustrates security coverage just on The Enterprisers Project.
This analysis aims to uncover hidden narratives that the media is writing about. It’s clear that security is a relevant topic across these five media sites. But you must ask yourself, “What about security is driving media relevance?” In other words, it’s the context of the coverage that we’re looking at here. I like to call this data interrogation.
When looking at the five media pubs collectively, cloud and network security are the top narrative drivers, followed by cyber-attacks, research, and reports. These are the themes represented in that first inner circle of the landscape analysis, each color-coded. The size of each section is significant. It means the volume of coverage about that specific topic.
It is also important to note that these are verbatim keywords and phrases that are scraped directly from news and feature stories, headlines, and the body of the article.
What is also important to mention is the second layer of keywords and phrases. If we look just at the cloud narrative, we can see that coverage around compliance, access, cloud platforms, and company news or what’s driving coverage. Peeling the onion back even further, we can see that the cloud narrative of company news mentions Google at a high volume, followed by cloud migration and customers.
On the other hand, security coverage on The Enterprisers Project tells a different story. While they are also writing about cloud security, they’re also covering the business side of security. Topics like business agility, CIO leadership, and business continuity are at the forefront. The data also shows highly technical stories this media outlet covers–Kubernetes, automation, open-source, and DevOps driving significant coverage.
This analysis aims to understand the context of security coverage without reading thousands of articles. Journalism today is not easy to measure. It’s s dynamic field that changes and evolves with society. The constant is data, and more importantly, data is used to interpret and predict media relevance.
How is This Media Outlet Data Actionable?
Well, it goes back to the model of supply and demand. In this analysis, we can identify those hidden narratives and stories that demand the media’s attention. If you know what the media is craving and can predict the levels they want to write about, you can position your supply of content (stories, pitches, emails, social content) to meet those audience demands.
The challenge is that you can’t just pull this data straight from the Internet. You’d need to invest in media monitoring software to help automate some of the data extraction and analysis. Here’s another example, but with a focus on business press.
How to Identify the Top News Outlets
Securing coverage in the business press will always be necessary for executive visibility, earnings, product launches, and other business-related issues. At the same time, tech and consumer media may also be a priority for different reasons.
Savvy PR pros know this and are segmenting their earned media plans by media type.
By segmenting the news media by business, financial, tech, lifestyle, consumer, and trade, you can create custom narratives that align with each media segment. For example, if you have a news story about automation, the business news media might want to write about it through the lens of jobs and the digital workplace. Their angle might be more about using AI and robotics for tech media.
This strategy is smart because reporters and journalists want to write relevant stories. So the pitch needs to draw them in.
At the top of the priority list is usually the business press and for a good reason. Most of the top business outlets have high readership and engagement. And who doesn’t like bragging rights when you can secure media coverage in the Times or the Wall Street Journal? But even then, it can be challenging to identify the top outlets after, say, The New York Times and The Wall Street Journal.
Here are five tips to help you identify and prioritize your public relations strategy’s top outlets. And guess what, it starts with data.
Start by Analyzing Your Media Coverage
This should always be the first step in any analysis. You need to know which media outlets are covering your business, the volume of published news articles, and the coverage’s context. I am not talking about a coverage report or counting how many media hits you had last month, either.
- The volume of coverage. This is one of the more straightforward insights because it’s just counting numbers. However, it’s crucial to analyze the types of stories covered, not just the number of pieces. Understanding the difference between headline features, media mentions, or exclusives is critical. This data can be pulled manually from Google Alerts or using a media monitoring service like Cision or Meltwater.
- Analyzing the context of your coverage. This is a more complex analysis. It involves clustering the business news coverage and using technology like artificial intelligence (AI) and natural language processing (NLP) to group the coverage into relevant themes and topics. Without reading through a million news articles, the insights can show trends in your media coverage. More on that later in this post.
Analyze the Media Outlet’s Readership
After you understand which outlets are writing about your company and the context of the coverage, it’s time to analyze the media readership. Unfortunately, this data point is a little misleading, and many PR pros use it as impression data for measurement purposes. See my post on earned media value and why impression data is flawed.
There are two ways to look at the readership of business news outlets–UVMs and the size of social audiences.
Most media monitoring tools like Muck Rack or Cision have API integrations with platforms like SimilarWeb, which provides UVM (unique visitors monthly) data for every website. Similar Web also offers free access to some of the data as well.
Below is a quick example of a free report that compares traffic data from Bloomberg and The New York Times. Based on this report, The New York Times (353.8M web visitors) gets 5X more web traffic than Bloomberg (76.4M web visitors).
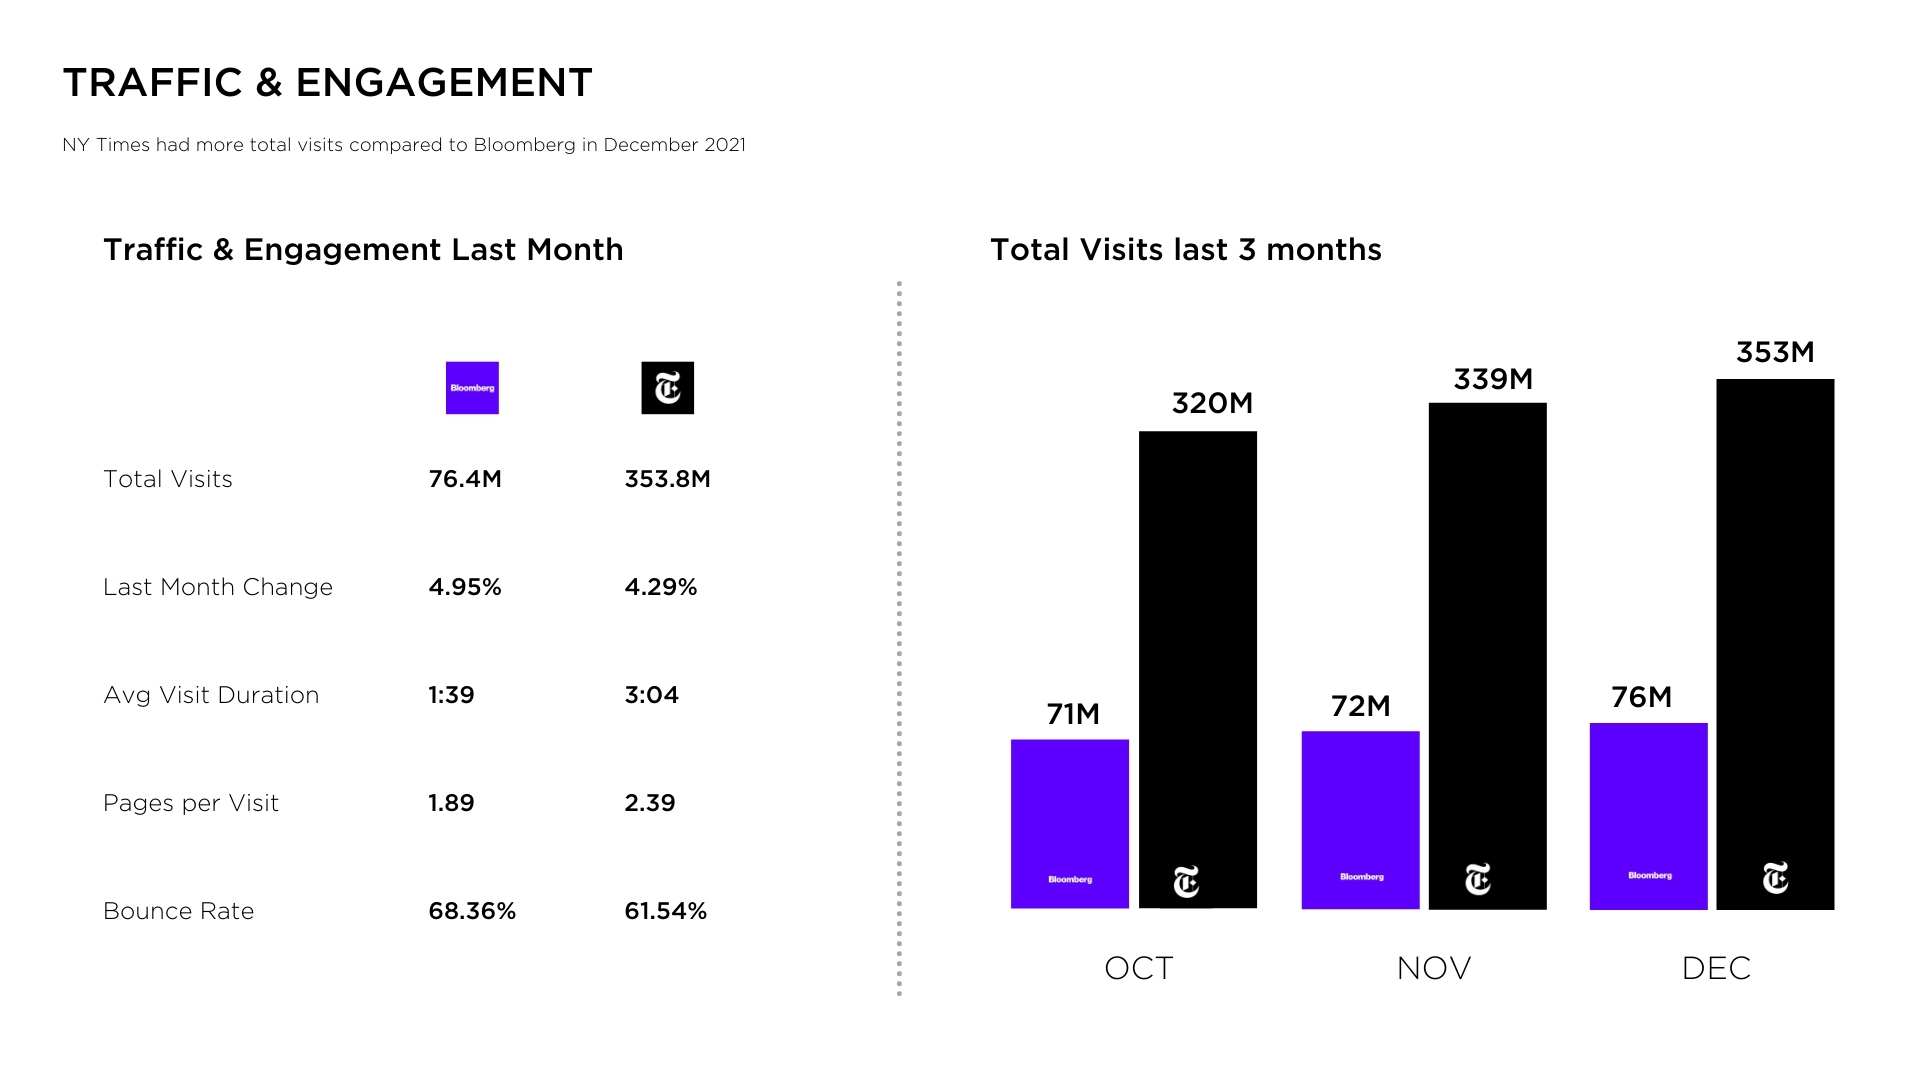
There are a few distinctions that should be noted in this information. First, it only provides the last three months of data, so it’s hard to get reliable historical insights. Also, this data doesn’t include “unique” visitors, just total visitors. So if one person went to Bloomberg and read 500 news articles, that would count as 500 visits.
UVMs or total visits are not synonymous with impressions. For example, if you get media coverage on Bloomberg, it doesn’t mean your article received 76.4M impressions. The total visit data is at the domain level and accounts for the tens of thousands of online articles published on the site.
Directionally, UVM data is a decent indicator of media readership.
Another data point to consider is the size of the media publication’s online presence on social media. Again, it’s simple math, but it’s a good indicator. This is important because all news media publications will use social media to distribute their coverage.
Identifying Business & Tech Journalists
After you understand which news outlets are writing about your company and the context of the coverage, it’s time to understand more about the journalists writing the articles. The result of this type of analysis is a prioritized media list.
There are a few ways to do this. The first is to use a tool like Muck Rack, which provides social media data for most journalists. They also publish content that lists top journalists in different sectors. Here’s an example from 2019.
This data point is a little more challenging, and some would argue that journalists’ reach and engagement aren’t that important. In either case, it wouldn’t hurt to understand how journalists write their articles and whether they share those stories on their social media channels.
For this post, I wanted to experiment to see what type of data might be helpful when looking at specific journalists and their social media content. I started by Googling the “top 25 tech and business journalists” and found several lists and reports from different vendors and agencies. I don’t think these lists weren’t built using an algorithm or math, but many of the names I recognized.
I chose the top 25 journalists picking from these lists. For reference, these are journalists from WIRED, Fortune, VentureBeat, CNBC, The Verge, Business Insider, Forbes, GeekWire, CBS Interactive, SiliconANGLE, TechCrunch, Datanami, DarkReading, and CRN.
I scraped, analyzed, clustered, and plotted all the content they shared and published across the outlets they wrote for and their social media accounts. The data equated to the following:
- 34K posts/articles (volume)
- 77K engagements (resonance)
- 1B potential impressions (reach)
The data is only useful when it’s broken down by topic. So, I clustered the content by topic and then looked at the distribution of engagements and reach.
The X-axis is the total volume. The Y-axis is resonance. I prefer to call it resonance because when a journalist writes or shares an article about a topic that resonates with their audience, it will most likely turn into a social action or engagement. The size of the bubble is reach and is equivalent to the audience size of every person engaged with the content.
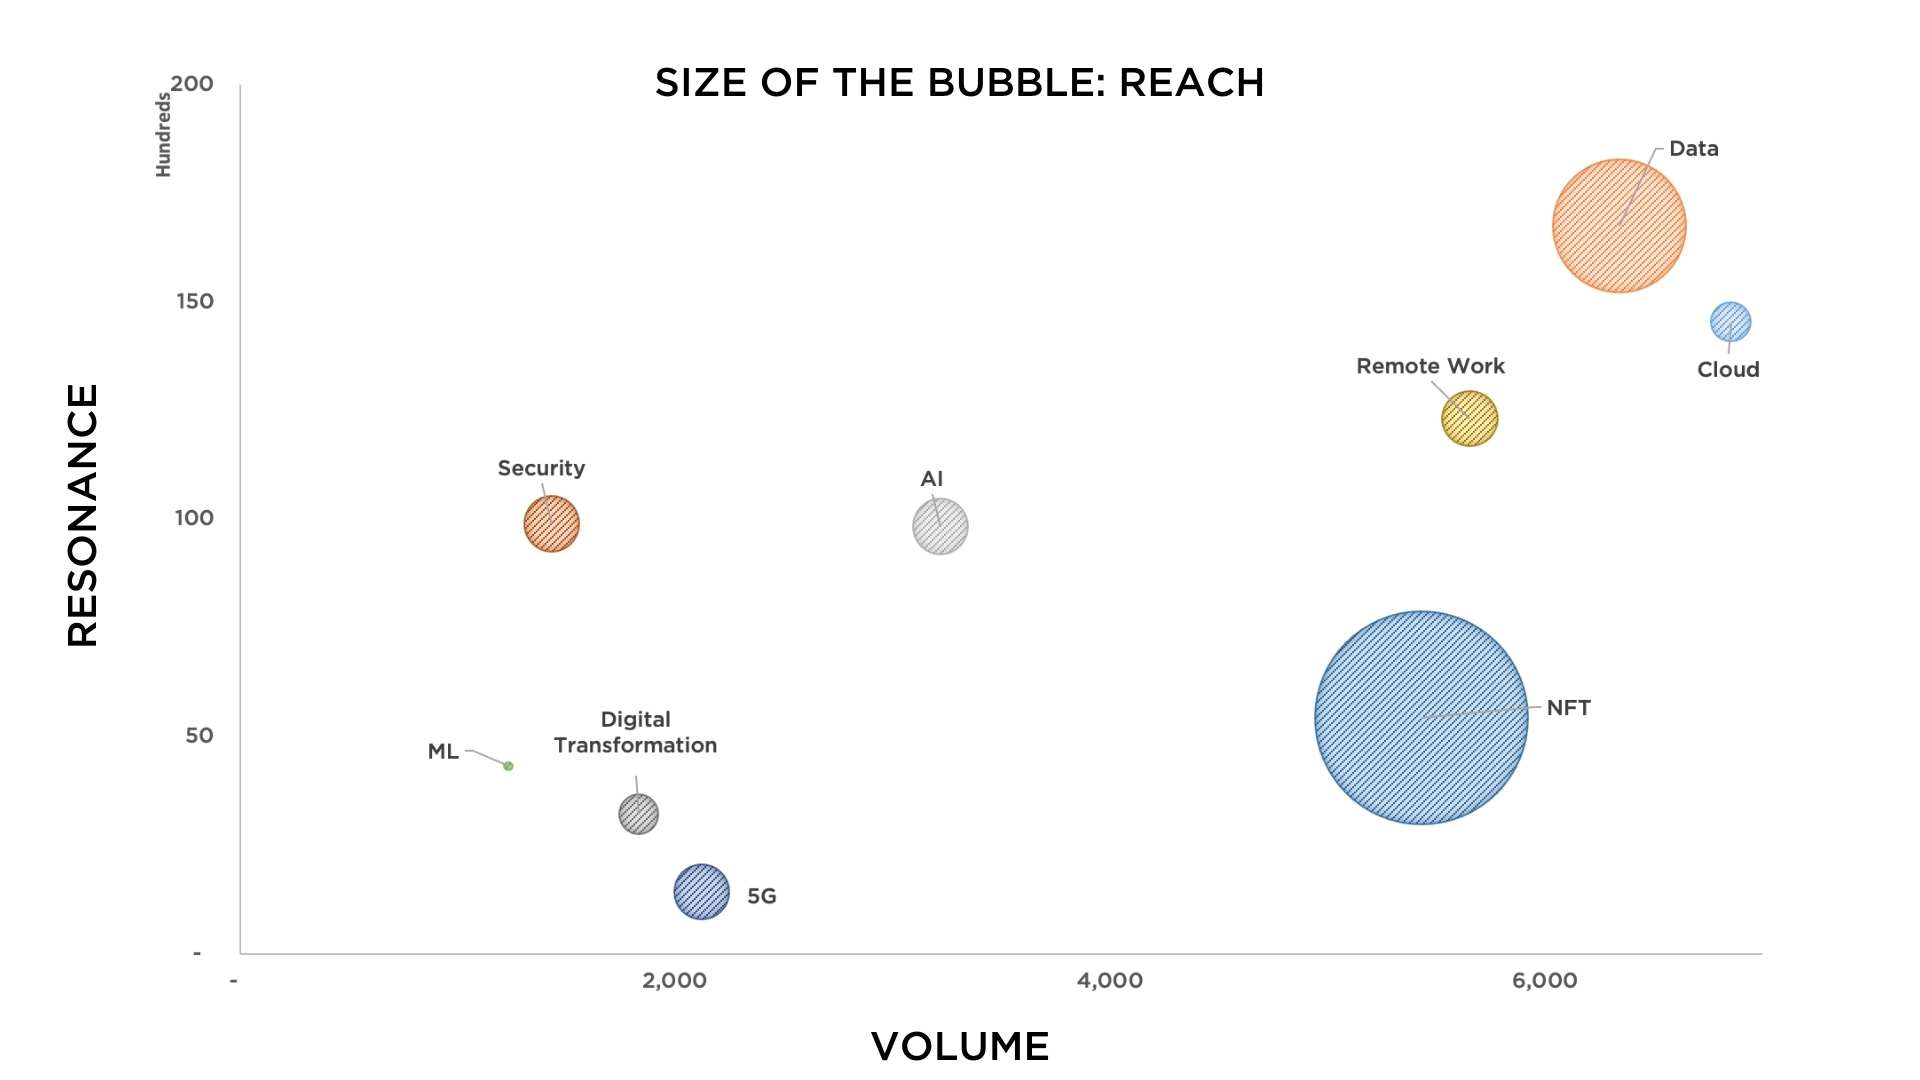
One thing that caught my attention was the distribution of engagements. You can see that some topics have more resonance than others, but there’s no one size fits all answer regarding media interest and relevancy. The data suggest a high interest in these topics from the journalists and their audiences.
This is one of many data points to consider when determining the top outlets to target. Journalist data is helpful because it displays a certain level of influence and topical authority.
Determine the Impact of Business News
Not every news outlet is created equal. Therefore, the analysis should always start with a topical segmentation when identifying the top media outlets and business news sites. For example, The New York Times writes about international business, the economy, finance, investing, the stock market, the latest business trends, and other world issues.
Fortune may cover some of these topics, but their commentary is more about the latest trends in technology, management, personal finance, marketing, online media, research, and entrepreneurship.
A topical analysis will help you identify the news outlets driving impact when they cover a specific topic like AI, 5G, international business, or anything related to NFTs.
Similar to the journalist research above, one way to show the business impact of the media covering a specific topic or industry is to do s topical segmentation analysis like the one below.
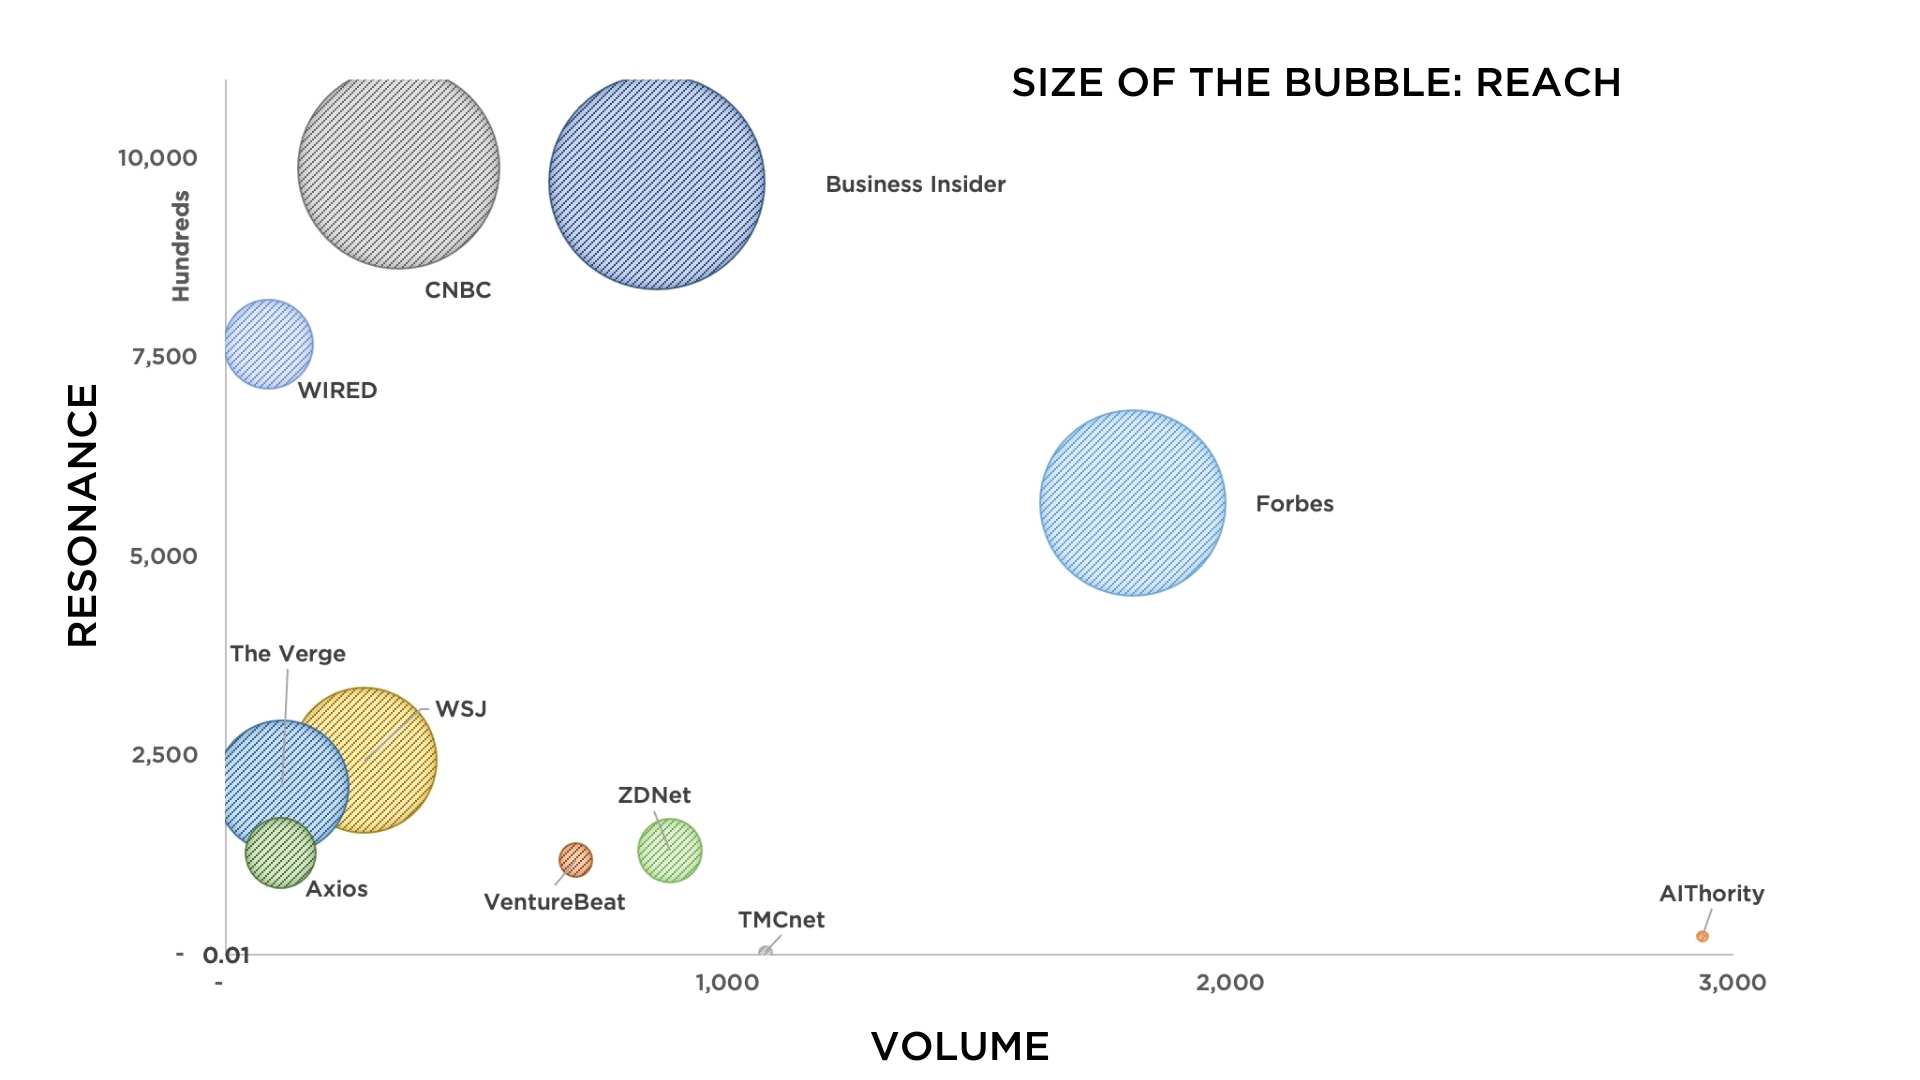
This analysis is three years old but features the top business news and technology pubs covering artificial intelligence. The X-axis is the total volume of news articles published. The Y-axis is resonance, a data point that shows how much the content resonates with their readership. The size of the bubble is the reach of publication with the UVM number I discussed above.
Contextualize News Coverage
The data above counts numbers related to topics, stories, volume, and engagement. While these insights are important, the last step in identifying the top media sites is contextualizing the coverage.
The data represents technology and business news coverage clustered into data visualization. The articles are clustered based on volume and then re-clustered into subtopics.
For example, all the articles in the cloud category feature solutions, providers, edge computing, international, and general technology. So, you can start contextualizing the coverage based on these groupings without reading hundreds of articles.
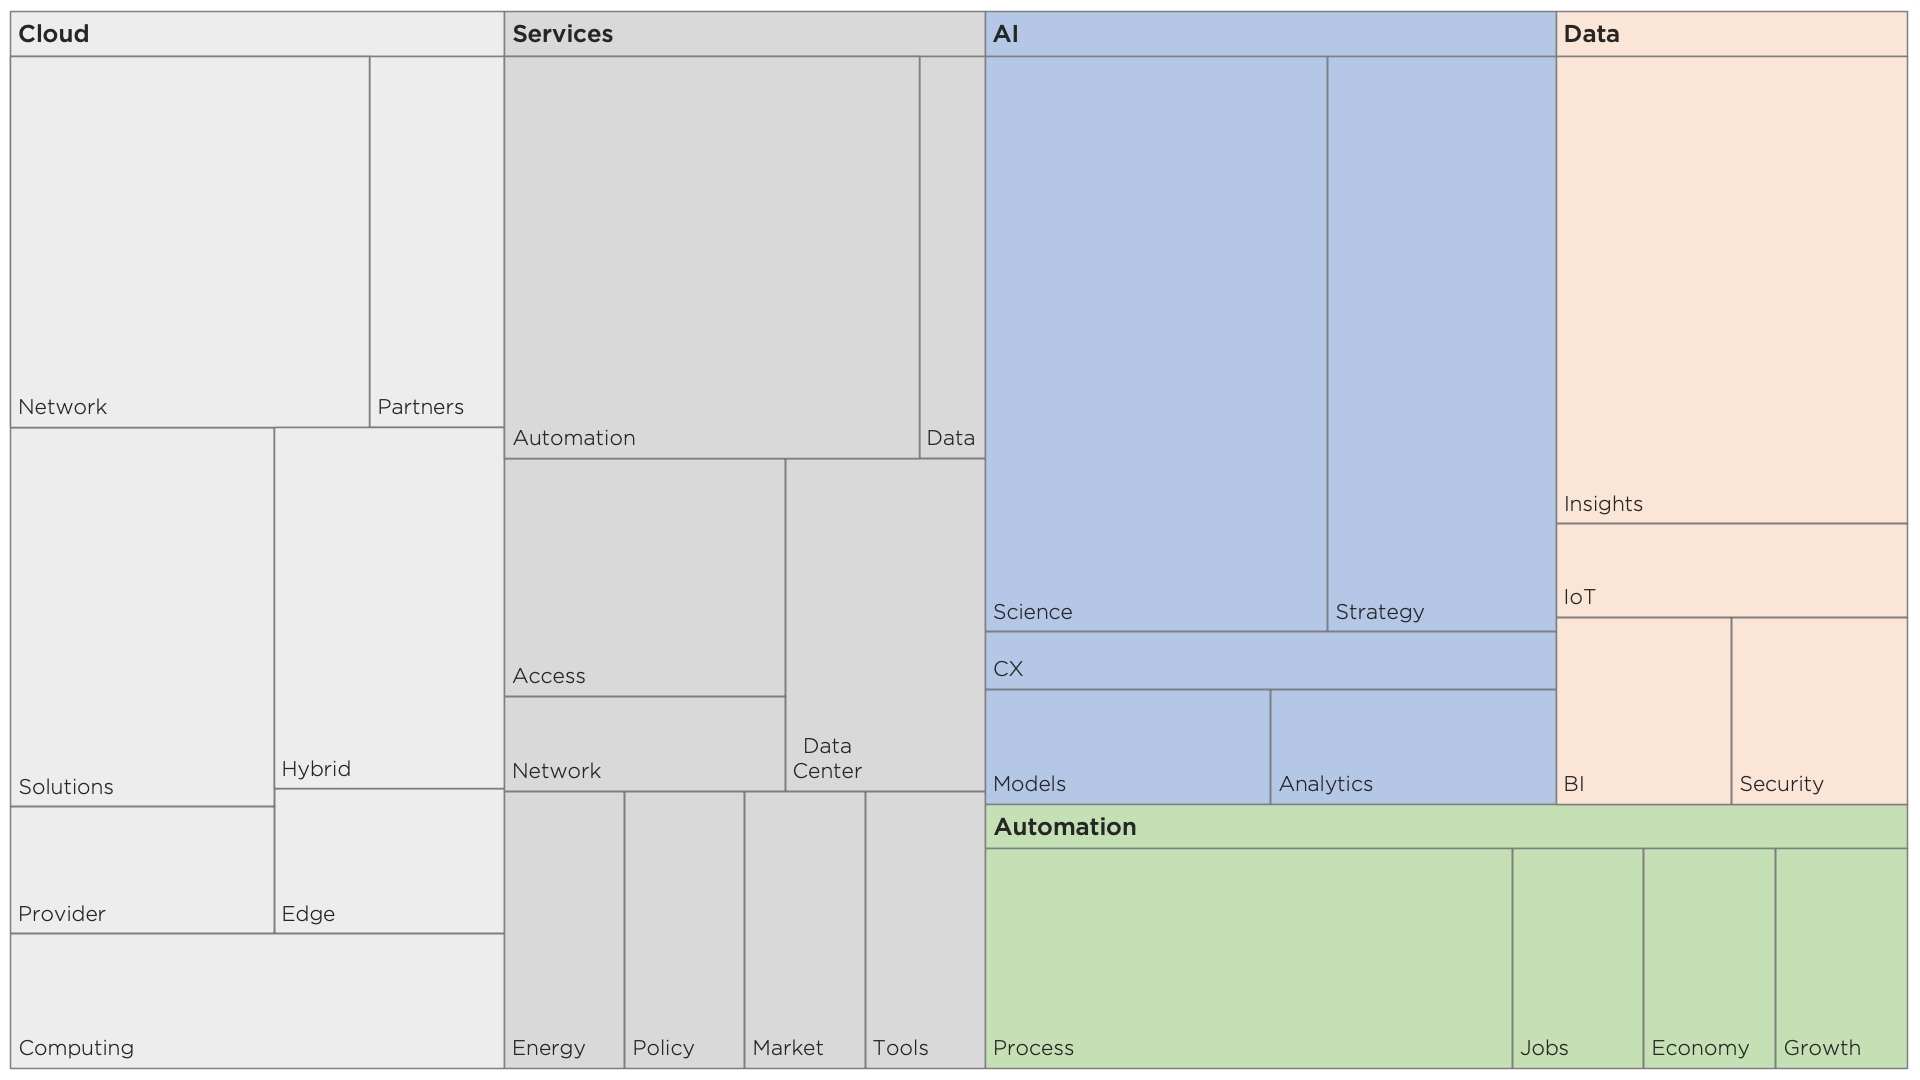
More importantly, you can start understanding the language and vernacular of how these media outlets craft their stories. This analysis can help inform the PESO media model for planning and integration.
FAQ
Q: What are the top news outlets?
A: The top business news outlets are determined by their resonance with readers, influence level, and the industry’s topical authority. You were expecting a list, huh?
Q: How do you build a media list?
A: The first step is to do a topical analysis of the content to identify the new outlets that were driving impact. The next step is contextualizing the coverage by clustering the articles into groupings based on volume and subtopics.
Q: How important is volume when analyzing news media?
A: Volume is significant because it shows how much the outlet publishes on a specific topic. The more they post, the more likely they drive the industry conversation.
Q: How do you measure topical authority with business news?
A: Topical authority is measured by how much the outlet is driving the conversation in the industry and how that content resonates with its audiences.
Q: How important is search when analyzing the media?
A: Search is important because it shows people’s interest in a specific topic. The more people search for a topic, the more likely the outlet is to cover it.
Related Content